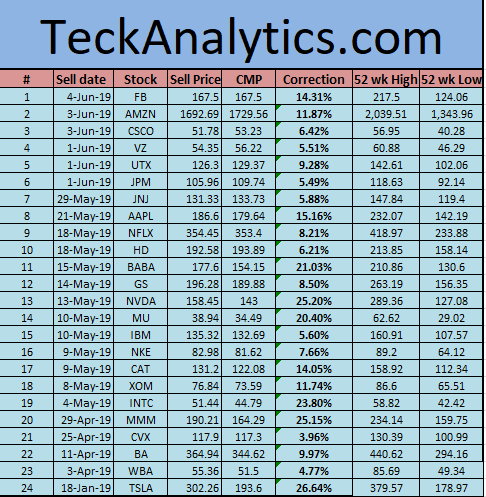
DOW & Nasdaq stocks correction/Bear Cycle started in last 60 days- April-June 2019
Technical chart weekly review of NSE 200 BreakOut stocks with profit more than 10% within 3-4 weeks detected by Teckanalytics.com software.
2 Days Intraday Technical Chart Analysis Training and Trading from Teckanalytics Experts in Jaipur, Delhi on live calls.
Learn to find Intraday stocks
Technical Chart parameters for Intraday charts
Learn to analyze as per tech chart
Learn when to enter and exit
Resistance and Support
Stoploss and Targets
Risk and Reward ratio
Special Discount for Females, unemployed and Sr. Citizen
Limited seats In person and Skype (online)
For registration, accomodation details contact
Email-Support@Teckanalytics.com
Whatsup @ 9205492389