Dear Reader,
To help traders and investors to trade as per moving averages we have started to publish Exponential and Simple Moving Daily Average Data for Free/paid members.
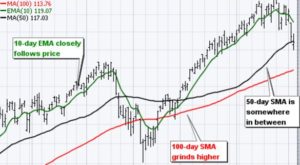
Every stock follows Moving averages. It depends what type of trader or investor you are. Daily trader or short trader follows DMA3 and DMA 5 closely where as long term investors follow DMA 20, DMA50 OR DMA200. They prefer to buy a stock whenever it hits higher days DMA values.
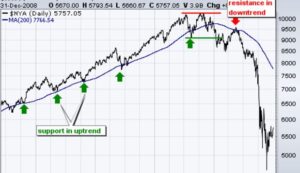
Lets say if stock is on up trend and you want to enter into Bull cycle, wait for Price to come down at DMA 3, DMA5 or DMA20.
Stock price likely to bounce back as soon as it hits moving average. Big investors wait to buy stock at higher MAs means cheaper price or better value.
DMA value in Red means Resistance and Green means Support
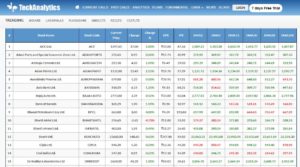
Now all our viewer can find out stocks which are Daily Simple moving average updates every 30 mints.
www.teckanalytics.com/live
It will save tons of time for the traders and investors who trade as per Moving averages.
You don’t have to look into Technical chart to find out averages. Our in built software algorithm will calculate DMA & EMA for Nifty50 & Mid Cap stocks and below listed Index.
- Realty
- Bank
- PSU Bank
- Private Bank
- Pharma
- Metal
- Media
- IT
- FMCG
- Finance
- Auto
Bull, Price Correction, Bull Breakout and Bear long term calls are published for our paid subscribers in the current alert list.
www.teckanalytics.com/alertlist