Login to www.Teckanalytics.com to see Live signals
TeckAnalytics is looking to expand its product and services to its North American & global customers which requires VC funding mainly. If you happen to be VCs and interested to invest in our Startup, please feel free to contact us thru email- support@teckanaytics.com
Teckanalytics.com is now offering Mutual Fund & customized Portfolios to Buy/Sell/Hold calls based on Technical analysis. If you have or follow or invest SIP in any specific Mutual Fund and interested to trade MF portfolio stocks which are Fundamentally picked by MF managers.
Our software service can suggest you when to invest in MF stocks based on Technical charts which means you may be buying at bottom and selling at top.
Please contact on 9205492389 or reply to support@teckanalytics.com for detailed info.
www.Teckanalytics.com
How to Trade Live Bull/Breakout calls with limit or market price?
Every Day after market 7.30 pm IST we add new calls on website.
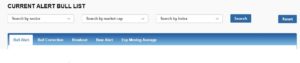
Log in to Teckanalytics.com and see Live calls and check for Bull/Breakout alerts.
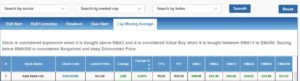
You can buy latest calls of your choice at current price (means today’s closing price) or EMA3/EMA5 value from Exp moving average data.
See Axis is a Breakout call and today’s closing price 553.65.
Go to Exp Moving average data
Now we can place limit order AMO/BMO at Closing price 553.65 or EMA 3 (549.99) or EMA5 (547.44)
Paid members any queries, pls call or Email- Support@teckanalytics.com
Dear Member,
How to calculate Risk % ratio?
Log in with your valid id.
Go to the Live current Bull or Break Out alert page.
Click on the stock you want to trade.
See the Stock data
If EMA13% OR DMA15% value is below 3%. Your risk is 3%.
If EMA13% OR DMA15% more than 6%. Avoid Buy that stock as Bull or Breakout candidate. Risk is 6% or more.
Try to trade for the stock whose EMA5% or DMA5% is between -2% to 3% from the Bull or Breakout alert list.
Most of the trade range during day happen between EM3/DMA3 to EMA5/DMA5. For bigger Profit, EMA13/DMA15 values can be used to buy.
For Hedging- Calcualtion is same except -% to be considered for Risk.
Technical chart weekly review of NSE 200 BreakOut stocks with profit more than 10% within 3-4 weeks detected by Teckanalytics.com software.
Dear Readers,
There are are four different type of stock phases in the stock market.
Bull means Buying
BreakOut- Heavy buying without any technical resistance
Bull Correction- Price correction
Bear- Hedging
What is a Bull Stock?
Bull cycle is considered when buyers are willing to pay higher price for a stock. Generally, there are more buyers than sellers in the market. It leads to higher price upward movements.
There could be many reasons for a Bull cycle i.e. great earning report, beating market/analyst expectations, positive future growth, rating upgrades, strong fundamental, technical, overall Bull market or sector or global reasons for a Bull cycle.
What is a Bull Correction Stock?
Stock is considered in Price/Bull correction when price drops down from the last Peak price. Generally 5%-14% is considered good price correction. Investors considered this as a good opportunity to invest money in the ongoing Bull stocks. This is also consolidation process where investors and FIIs, DIIs slowly keep buying and consolidate there stock position.
There is always risk of going Price correction stock into Bear Cycle if price goes down more than 20%.
What is a Breakout Stock?
Breakout stock situation is purely technical indicators driven. Whenever certain technical parameters fulfill the certain conditions, like Moving averages crossing each others. Stock tend to rise sharply in a few days to few weeks. Generally price 5% to 20% can be increased in few weeks.
What is a Bear Stock?
Bear cycle is considered when sellers are willing to accept lesser money for a stock. Generally, there are more sellers in the market than buyers. It leads to downward price movements for a Bear cycle, bad earning, negative future growth, rating downgrades, weak fundamentals, higher debts or interest payment, legal issue, technical, overall Bear market or sector or global
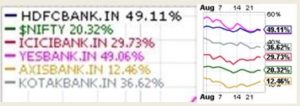
Nifty Vs Top Private Bank performance in 2017 as of 24/8/17
HDFCBANK
YESBANK
KOTAKBANK
ICICIBANK
AXISBANK